
Doing seo reporting with looker studio means building your own dashboard on top of Google’s free reporting tool by connecting it directly to your Search Console and Google Analytics 4 data — Looker Studio itself has no idea what SEO is; it’s a general-purpose visualization layer that becomes an SEO dashboard only once you wire up the right data sources and charts. This is a genuinely good option for teams who want full control over what a report looks like and don’t mind the setup work. It’s also worth knowing upfront: this guide is honest that Looker Studio requires you to build the connections yourself — there’s no one-click SEO template that populates itself with your specific data, and no tool, SEO Rocket included, has a native “push data into Looker Studio” connector. What follows is the actual build process, plus a look at when a pre-built dashboard is simply the faster answer.
What Looker Studio Actually Is
Looker Studio (formerly Google Data Studio) is a free tool from Google for turning data from various sources into interactive charts, tables, and dashboards that can be viewed in a browser or shared as a link. It connects to dozens of data sources — Google Sheets, BigQuery, Google Ads, and, relevant here, Search Console and Google Analytics 4 — through built-in connectors that Google maintains. It does not pull in ranking data, backlink data, or competitor data on its own; anything beyond what GSC and GA4 report has to come from a separate source, either manually via a spreadsheet or through a third-party connector if one exists for that specific tool. Understanding that boundary upfront avoids the common disappointment of building a Looker Studio report and expecting it to somehow know about keyword rankings it was never given.
Step 1: Start a New Report
Go to lookerstudio.google.com, sign in with the Google account that has access to your Search Console property and GA4 account, and click “Blank Report” (or start from one of Google’s own templates if one fits, though most SEO-specific templates online are built by third parties and vary widely in quality). You’ll be prompted to add a data source immediately — this is the first and most important decision in the build.
Step 2: Connect Google Search Console
Search Console is the more important of the two connections for SEO reporting, since it’s the only source with actual keyword query and search-position data. Choose “Search Console” from the connector list, select the property (make sure you’re using the correct one if you have both a domain property and a URL-prefix property set up), and choose whether to connect the “Site Impression” table (query and page-level data) or the “URL Impression” table. Most SEO reports use Site Impression, which gives you clicks, impressions, CTR, and average position, broken down by query, page, country, and device. One quirk worth knowing: Search Console data in Looker Studio is capped and sampled the same way it is in the GSC interface itself, and it only retains around 16 months of history, so long-term year-over-year comparisons need to be pulled and archived manually if you need to go back further.
Step 3: Connect Google Analytics 4
Add a second data source and choose the GA4 connector, then select the correct property and, if relevant, the specific data stream. This gives you access to sessions, engagement rate, conversions (key events), and channel data — critically, this is where you’d filter or segment for “Organic Search” to see how the traffic that Search Console shows as impressions and clicks actually behaves once it lands on the site. GA4 and GSC don’t automatically merge into one unified table inside Looker Studio; they remain two separate data sources that you place on the same page and, if needed, blend together using Looker Studio’s data blending feature, which joins them on a shared dimension like landing page URL.
Step 4: Build the Actual Charts
With both sources connected, a solid baseline SEO report usually includes a handful of components rather than an overwhelming wall of charts:
- Trend chart: clicks and impressions from GSC over time, ideally with a comparison period toggle.
- Top queries table: query, clicks, impressions, CTR, and average position, sortable, from the Search Console data source.
- Top landing pages table: same metrics but grouped by page instead of query, useful for spotting which content is actually earning visibility.
- Organic traffic trend: sessions and key events from GA4, filtered to Organic Search, to show whether visibility is translating into real outcomes.
- Device and country breakdown: useful context, especially for sites with meaningfully different mobile vs. desktop performance or specific target markets.
- Scorecards: single-number summary tiles for total clicks, average position, organic sessions, and key events for the period, placed at the top of the report for a fast read.
Use filters and date-range controls liberally so the same report can be reused month to month rather than rebuilt from scratch, and set up a comparison date range if you want period-over-period change shown automatically instead of calculated by hand.
Step 5: Share or Automate Delivery
Once the report is built, share it the same way as any Google file — a viewer link, or scheduled email delivery of a snapshot on a recurring basis (Looker Studio can email a PDF or image export to a list of recipients on a set schedule). For agencies reporting to multiple clients, this usually means duplicating the report template per client and repointing the data sources at each client’s GSC and GA4 accounts, which works but does mean maintaining a separate copy per client rather than one dashboard that serves everyone.
Where the Effort Actually Goes
The honest time cost of Looker Studio isn’t the initial chart-building — that’s a few hours once you know the connectors. It’s the maintenance: data source connections that occasionally need re-authenticating, GA4 schema changes that break a chart relying on a specific dimension, blended data sources that behave unexpectedly when one source has a gap, and the per-client duplication work for anyone reporting to more than a couple of clients. None of this is a knock on the tool — it’s simply what “build it yourself” costs, and it’s worth weighing against the alternative below before committing to it as your only reporting method.
| Looker Studio (self-built) | SEO Rocket’s built-in dashboard | |
|---|---|---|
| Setup effort | Manual — connect GSC/GA4, build charts, style the report | Zero-setup once GSC/GA4 are connected in SEO Rocket |
| Ranking & backlink data | Not included; needs a separate source | Included, from Ahrefs data already in the platform |
| Design control | Full — any layout, chart type, or branding | Fixed layout, less flexible |
| Multi-client scaling | Duplicate and repoint per client manually | Per-project dashboard generated automatically |
| Maintenance | Ongoing — reconnects, schema changes, blend issues | Maintained as part of the platform |
| Cost | Free (Looker Studio itself has no charge) | Included on SEO Rocket plans, free tier available |
The Zero-Setup Alternative
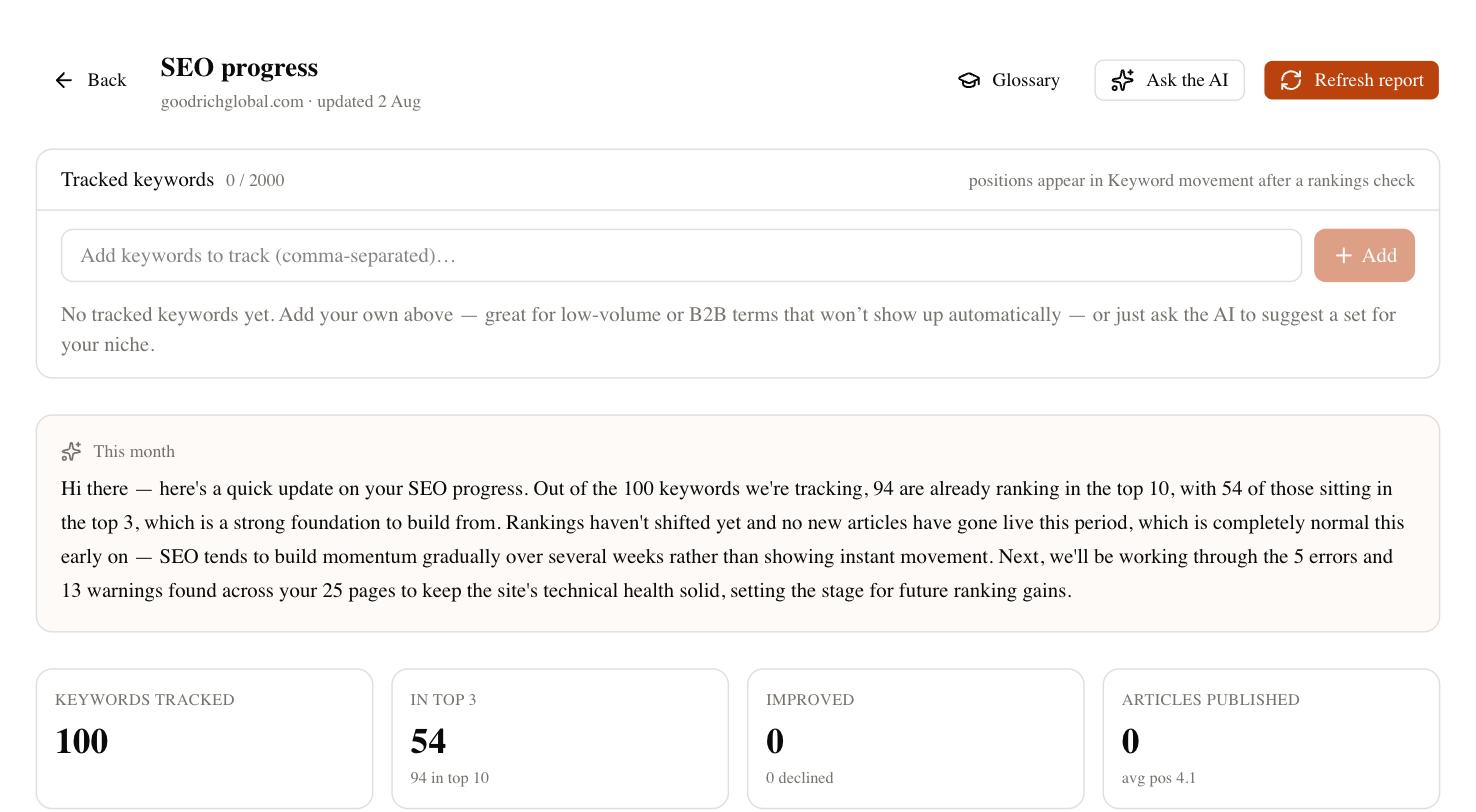
Not every team wants to own the maintenance of a Looker Studio report, and that’s a reasonable position, not a shortcut. SEO Rocket includes a built-in, shareable dashboard that pulls together rankings, organic traffic (once you connect GSC and GA4 to the project), and the SEO work that’s actually shipped — content published, audits run, keywords tracked — into one read-only link you can send to a client or stakeholder without building anything. It’s not a Looker Studio replacement in the sense of infinite customization; it’s a fixed, purpose-built report designed to answer “how is SEO going” without the setup and upkeep of a self-built dashboard. Some teams use both: Looker Studio for a fully custom internal report, and SEO Rocket’s dashboard as the fast, shareable version for clients.
Frequently Asked Questions
Does Looker Studio connect to SEO Rocket directly?
No — SEO Rocket does not have a Looker Studio connector. If you want SEO Rocket’s data (rankings, backlinks, content-gap data) inside a Looker Studio report, you’d need to export it manually or via a Sheets intermediary; there’s no native, automated pipe between the two tools today.
Is Looker Studio really free?
Yes, for the core product and the GSC/GA4 connectors used in this guide. Some third-party connectors for other data sources charge a fee, but nothing described here does.
Why doesn’t my Search Console data in Looker Studio match the GSC interface exactly?
Small discrepancies are normal and usually come from timezone handling, sampling on high-volume properties, or date range boundaries being calculated slightly differently between the two interfaces. Large discrepancies usually mean the wrong property or table was connected.
Can I combine multiple clients’ data into one Looker Studio report?
Not cleanly with the standard connectors — each GSC and GA4 connection is tied to one property. Agencies typically solve this with one report template duplicated per client, or by exporting data into a shared spreadsheet first.
If building and maintaining Looker Studio reports isn’t where you want to spend time, SEO Rocket’s built-in dashboard gives clients a live, shareable view of rankings and traffic with no setup. Try it free at app.seorocket.ai.