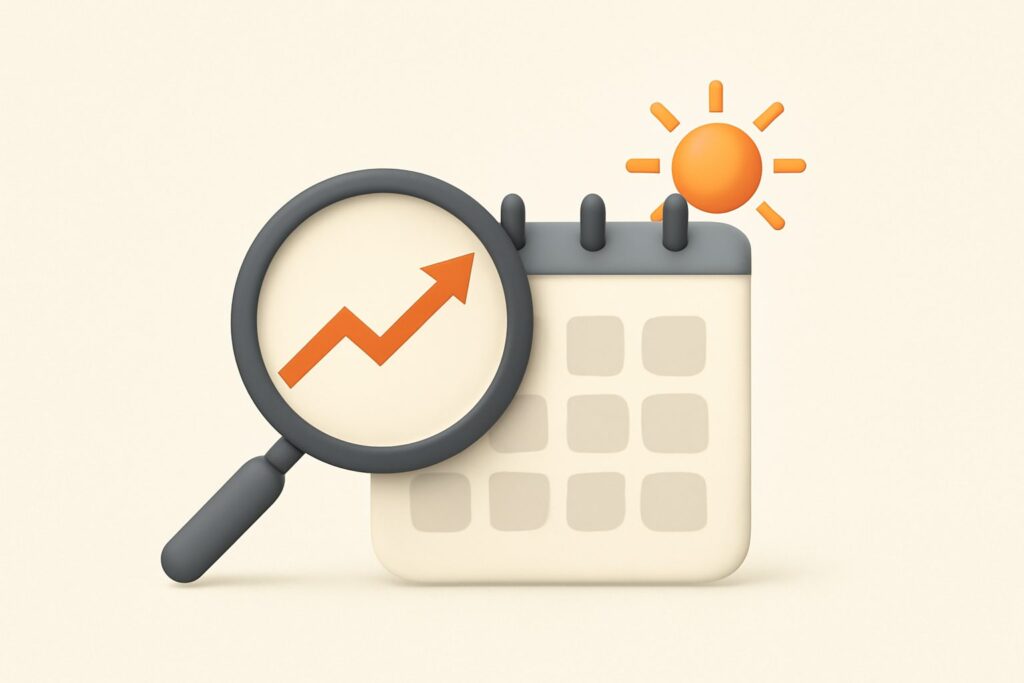
Most people reach for seasonality analysis in one of two dishonest ways. When traffic drops, “it’s just seasonal” becomes the alibi that stops anyone from investigating a real problem. When traffic climbs, the seasonal tailwind gets quietly credited to the last thing the team shipped. Both are the same mistake: treating the calendar as either an excuse or a bragging right instead of a variable you measure and remove. Done properly, seasonality analysis is the discipline that lets you tell whether a 30% swing is the season doing its normal work or your rankings actually moving — and those two conclusions demand opposite responses.
What Seasonality Analysis Actually Measures
Seasonality is the predictable, calendar-driven fluctuation in search demand for a topic — tax software peaking in the weeks before a filing deadline, “gifts for dad” spiking every June, air-conditioner queries collapsing in winter. It isn’t about the fact that demand moves; everyone knows it does. It’s about isolating that expected movement so you can see what’s left over. The leftover is the only part that reflects your work: your rankings, your click-through rate, your new pages, or a Google update that reshuffled the results.
The core equation is simple to state and easy to skip: observed change equals seasonal change plus performance change. If you don’t subtract the seasonal component, you attribute the whole swing to yourself — and you’ll either celebrate a tailwind you didn’t earn or panic over a dip that was always coming. Every technique below exists to estimate and strip out that first term.
Three Kinds of Seasonality People Keep Confusing
Not all seasonal patterns behave the same way, and treating them as one blob is why forecasts miss. There are three distinct types worth separating in any serious seasonal trends analysis:
- Calendar seasonality — recurring on a fixed schedule tied to weather, holidays, fiscal dates, or the academic year. It’s the most forecastable because it repeats within a tight window every year.
- Event-driven seasonality — tied to a moving or one-off trigger: a product launch, a sporting final, a regulatory change, a viral moment. It looks seasonal but the date shifts, so you can’t copy last year’s calendar blindly.
- Pseudo-seasonality — a pattern that looks like a season but is actually something else: a Google core update that happened to land in the same month two years running, or a competitor who always runs a Q4 campaign. Mislabel this as “the season” and you’ll stop investigating a cause you could act on.
The practical rule: before you file a swing under “seasonal,” ask whether it repeats on a fixed calendar, tracks a moving event, or just coincides with one. Only the first is safe to forecast from history alone.
The Year-over-Year Rule: Your Only Honest Baseline
The single most important move in seasonality seo is to stop comparing this month to last month. Month-over-month comparison bakes the season straight into your numbers — of course November beat October for a retailer, and of course January cratered. Comparing consecutive months during a seasonal business tells you almost nothing about performance.
Year-over-year (YoY) comparison is the fix. By lining up this November against last November, you hold the season roughly constant and expose the real delta. If demand for your category was flat year-on-year but your organic clicks rose 25%, that 25% is genuine — better rankings, better CTR, or new pages earning their keep. If your clicks fell while category demand held steady, you have a real problem the calendar can’t excuse. YoY isn’t perfect (the category itself can grow or shrink between years), which is exactly why the next step matters: you need an external read on demand to calibrate it.
Separate Demand From Performance
Your own analytics can’t distinguish “fewer people searched” from “the same people searched but we ranked worse.” Both show up as a traffic drop. To split them, you need a demand signal that’s independent of your site’s position. Google Trends is the accessible proxy: it shows relative search interest for a term or topic over time, so you can see the shape of the season without your rankings polluting it. If Trends shows category interest down 40% year-on-year and your traffic is down 35%, you’re actually outperforming the market. If Trends is flat and you’re down 35%, the season is a red herring.
This is where a data trust hierarchy earns its keep. Google Search Console and GA4 are ground truth for what happened on your property — real clicks, real impressions, real sessions. Third-party tools like Ahrefs give you modeled search volume and keyword difficulty: excellent for sizing demand and spotting competitive direction, but they’re estimates that lag and smooth. SEO Rocket bakes this hierarchy into how it reports, so the demand context (third-party volume trends) sits alongside your first-party performance instead of being mistaken for it. Trust Google for your own numbers; trust the estimators for the shape of the market.
Impressions First, Clicks Second
Inside Google Search Console, the order you read the metrics changes the diagnosis. During a seasonal shift, look at impressions before clicks. Impressions track how often your pages appeared for queries — a proxy for demand plus your ranking reach. Clicks track how often people chose you. Reading them together separates two very different stories:
- Impressions down, CTR steady: fewer searches happened. That’s demand — the season, and nothing to fix.
- Impressions steady, clicks down: the searches still happened but you’re losing the click. That’s a ranking or SERP-feature problem you can act on.
- Impressions up, clicks flat: you’re surfacing on more queries but not the right ones, or a new SERP feature is intercepting clicks.
Two cautions keep this honest. GSC data carries a roughly two-day lag, so the last couple of days always look soft — never diagnose a “drop” on incomplete data. And GSC anonymizes rare queries, so a chunk of long-tail seasonal terms simply won’t appear by name. Average position, likewise, is an average across every impression, not a live rank — a useful trend line, not a spot reading.
Rankings Are Trends, Not Spot Readings
The fastest way to invent a seasonal crisis that doesn’t exist is to check a keyword’s rank once and react. Positions jitter by two or three spots daily from personalization, location, and index churn — that’s normal noise, not a signal. Seasonal analysis lives at the level of trend lines over weeks, not screenshots from a single afternoon. A page that averaged position 4 all summer and reads position 6 on one Tuesday hasn’t necessarily slipped; you need the multi-week trend to know.
This is why rank tracking that stores daily snapshots and plots the trend beats a manual spot-check every time. SEO Rocket tracks positions as trends across the top 100 rather than one-off lookups, which is precisely what you need when you’re trying to see through daily jitter to the real seasonal movement underneath. The question is never “where do I rank today” — it’s “which direction has this been heading for the last month, and does that match the season or fight it.”
A Worked Example: The November Panic
Here’s the pattern I see every year. A B2B software site watches organic traffic fall 22% from October to November and someone schedules an emergency meeting. Run the actual analysis instead. First, YoY: last November was also down about 20% from its October — this is a normal calendar dip as buyers disengage before year-end. Second, Google Trends for the core category confirms interest softens every Q4. Third, GSC shows impressions down but CTR and average position dead flat year-on-year. The verdict: the season did exactly what it always does, performance is stable, and there’s nothing to fix. The right move is to hold course and prepare for the January demand rebound — not to thrash the strategy because a chart pointed down.
Now flip one variable. Same 22% drop, but average position slipped from 5 to 9 year-on-year while Trends stayed flat. That’s not the season — that’s a genuine ranking loss hiding behind a plausible seasonal story. Same surface number, opposite diagnosis, opposite action. Seasonality analysis is the only thing that tells them apart.
Build the Content Calendar Backward From the Peak
Seasonal analysis isn’t only defensive. Its most valuable output is timing your publishing so pages are ranking before demand arrives, not scrambling during it. New or updated content rarely ranks the day it ships — it commonly takes weeks to months for Google to crawl, evaluate, and settle a page into position. So a page targeting a December peak that goes live December 1 has missed the season entirely.
Work backward. Identify the peak from last year’s seasonal traffic seo data, subtract a realistic ranking lead time of two to three months, and that’s your publish-or-refresh deadline. For established pages, a refresh ahead of the season — updated data, current pricing, a fresh angle — often ranks faster than net-new content because the URL already has history. SEO Rocket’s keyword research pulls real Ahrefs volume and difficulty so you can size which seasonal terms are worth the lead time, and the validation-gated AI writer turns that into publishable drafts early enough to actually rank before the wave, instead of arriving after it’s crested. Publishing into demand before it arrives, rather than chasing it after the peak, is the same rhythm behind a playbook proven across 1,000,000+ ranking pages.
When to Act and When to Wait
All of this collapses into one decision rule. When you observe a swing, run the three checks in order: YoY delta, independent demand (Trends), and first-party diagnostics (GSC impressions, CTR, average-position trend). Then:
- Wait when the swing matches the season and your performance metrics are flat year-on-year. Reacting here means “fixing” something that isn’t broken and often making it worse.
- Act when performance moved independently of demand — clicks down while demand held, or position trending down over weeks. That’s a real signal the calendar can’t absorb.
- Investigate when the pattern is pseudo-seasonal — it lines up with a Google update or a competitor’s recurring campaign rather than genuine demand. There’s usually a cause you can address.
The discipline is refusing to act on a raw number until you’ve removed the seasonal component. Most “emergency” SEO drops are the season doing its job, and most quietly-missed problems are real losses wearing a seasonal disguise.
Frequently Asked Questions
How much historical data do I need for seasonality analysis?
At least two full years, ideally three. One year gives you a shape but no way to know if it repeats; two years lets you confirm a pattern is genuinely recurring rather than a one-off. With three years you can also see whether the season itself is growing or shrinking, which matters when you calibrate expectations.
Why doesn’t my Google Analytics traffic match Search Console?
Because they measure different things at different points. GSC counts search-side clicks and impressions; GA4 counts on-site sessions after the click, using an event-based model. Add sampling, deduplication, GSC’s two-day lag, and its anonymization of rare queries, and a gap is normal — expected, not a bug. Use GSC for search visibility and GA4 for on-site behavior; don’t expect the totals to reconcile.
Can I forecast seasonal traffic reliably?
You can forecast the shape and rough timing of calendar seasonality well once you have a couple of years of clean data. You can’t forecast the exact magnitude, because your own ranking changes, competitors, and Google updates all move the baseline between years. Treat a seasonal forecast as a planning range, not a promise — its real job is telling you when to publish, not predicting a precise number.
Is a traffic drop always seasonal if it happens every year?
No — that’s the pseudo-seasonality trap. A drop that recurs on the same date could be genuine demand softening, or it could be a Google update that keeps landing in the same window, or a rival’s annual campaign. Check independent demand with Google Trends; if demand is flat but you still drop, the calendar is a coincidence and there’s a real cause to find.