Figuring out how to create an seo report for clients is less about picking the right software and more about answering one question clearly: did the work move the numbers that matter to this specific business? Most SEO reports fail not because the data is wrong but because they bury a business owner in traffic charts and keyword counts without ever connecting that activity to something they care about — leads, calls, bookings, revenue. This guide covers what a genuinely useful report contains, how to structure it, and the three realistic ways to build one, including where SEO Rocket’s built-in dashboard fits as a legitimate shortcut rather than a workaround.
What a Client Actually Wants to Know
Strip away the SEO jargon and every client report is trying to answer the same three questions: is our visibility going up, is that visibility turning into business results, and what did you actually do this month to earn your fee. A report that nails all three in the first page is more valuable than one with twenty pages of data that never quite answers any of them directly. It’s worth writing those three questions at the top of your report template as a discipline check — if a section doesn’t help answer one of them, it’s probably filler.
What to Include: A Client Report Checklist
- Executive summary: three to five sentences, plain language, no jargon — the headline of what happened this period and why it matters.
- Ranking movement: tracked keyword positions, ideally grouped by priority (money keywords vs. informational) rather than one long undifferentiated list.
- Organic traffic trend: sessions from organic search over the reporting period, with a comparison to the prior period.
- Conversions from organic: leads, calls, form fills, or purchases attributed to organic traffic — this is usually the single most important number in the report and the one most reports skip.
- Top performing pages: which landing pages are earning the traffic and conversions, and which ones dropped.
- Work completed this period: content published, technical fixes shipped, links earned, on-page changes made — with enough specificity that “we did SEO” reads as a list of concrete actions, not a vague claim.
- Issues found and their status: anything the audit turned up, whether it’s fixed, in progress, or blocked (and by what — often this is a client-side dependency, which is worth surfacing honestly).
- Next period’s plan: what’s being worked on next and why, tied back to the priorities already agreed with the client.
Structuring the Report: Order Matters
Put the executive summary and the conversion/business-impact numbers first, not last. A common mistake is opening with a wall of keyword ranking tables because that’s the easiest data to pull, then burying the “did this generate leads” answer on page four — by then, a busy client has already skimmed past the part that actually matters to them. A better order: summary, business outcomes (traffic and conversions), then supporting detail (rankings, technical work, content shipped), then a forward-looking plan. Anyone who only reads the first section still walks away knowing whether things are working.
Three Real Ways to Build the Report
There isn’t one correct tool for this — the right choice depends on how much time you have, how many clients you’re reporting to, and how much customization each client actually needs.
Option 1: A Manual Deck or Document
Pulling screenshots and exports from Search Console, GA4, and your rank tracker into a slide deck or document gives full control over narrative and framing — you can write directly to what happened for that specific client that month. The tradeoff is time: this approach doesn’t scale past a handful of clients before the manual pulling and formatting becomes the bulk of an account manager’s week, and it’s also the easiest format to let slip when things get busy, which is exactly when clients notice.
Option 2: A Looker Studio Dashboard
Building a report in Looker Studio, Google’s free dashboard tool, by connecting your Search Console and GA4 data sources gives you a live, filterable report that updates on its own rather than a static snapshot — genuinely useful for clients who like to poke around data themselves. It requires real setup work (connecting sources, building charts, setting up sharing) and, notably, it doesn’t include ranking or backlink data on its own — Looker Studio only knows what GSC and GA4 tell it, so keyword position tracking and competitor data need a separate source layered in manually if you want them in the same report. It’s a strong option for teams with the time to build and maintain it, less so for anyone wanting a report ready this afternoon.
Option 3: SEO Rocket’s Built-In Client Dashboard
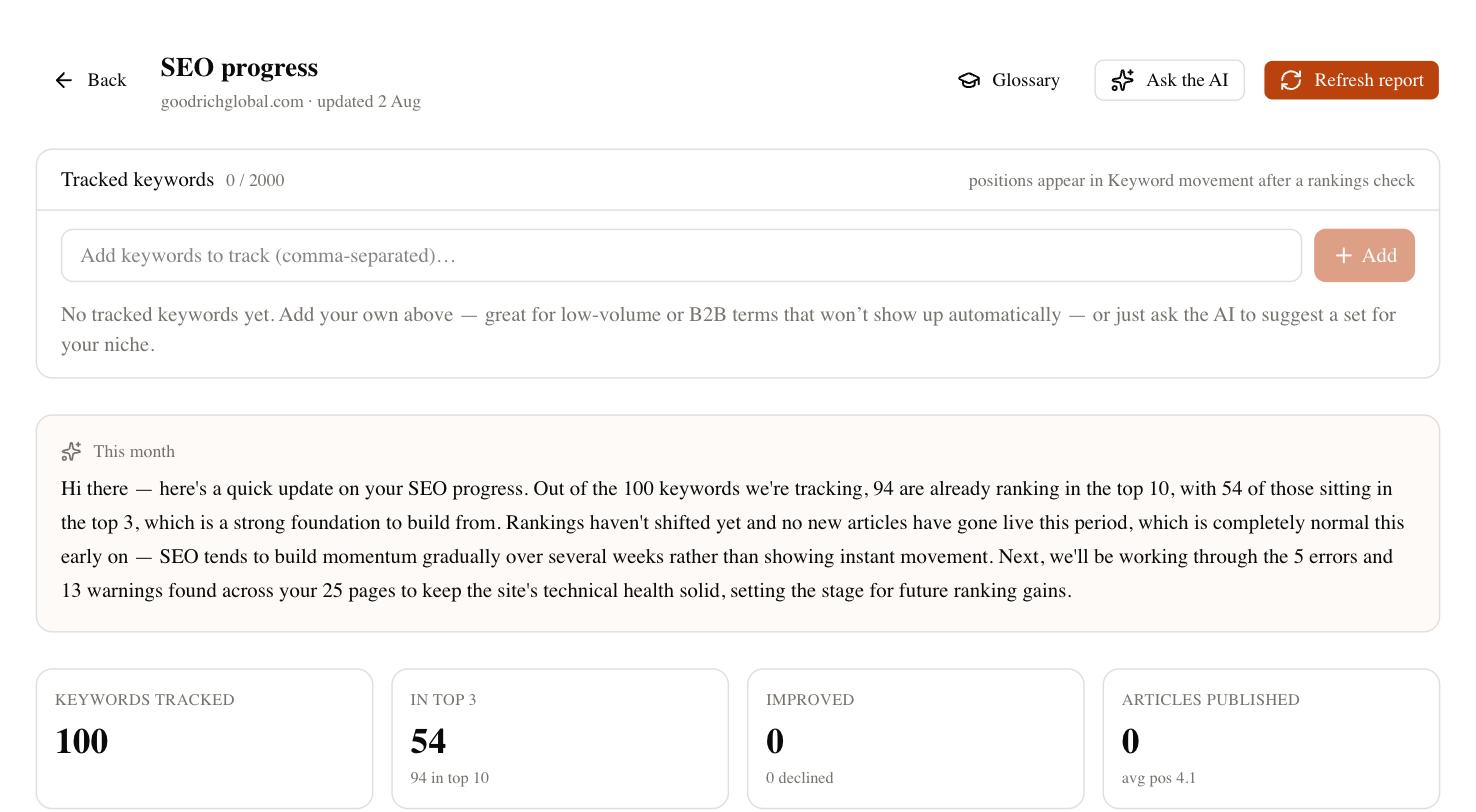
SEO Rocket includes a shareable, read-only dashboard built specifically for this use case: rankings, organic traffic (once GSC and GA4 are connected to the project), and a log of the SEO work actually shipped, all in one link a client can open anytime without you sending a new deck each month. It’s a genuine, working alternative to building a report by hand or in Looker Studio — not a marketing wrapper around the same manual work. It’s worth being clear about what it is and isn’t: it’s a progress and reporting view, not a tool that manages your Google Business Profile or writes your client’s report narrative for you — the executive summary and the “why this matters” framing are still a human judgment call, and probably should stay one, since that’s usually what a client is actually paying for in an account manager.
| Method | Best for | Tradeoff |
|---|---|---|
| Manual deck/document | Small client counts, highly custom narrative | Doesn’t scale; time-intensive every period |
| Looker Studio dashboard | Teams with setup time who want full design control | No rankings/backlinks natively; requires build and maintenance |
| SEO Rocket built-in dashboard | Fast, always-current, no-setup reporting | Fixed format, less customizable than a hand-built deck |
Writing the Narrative: Where Reports Usually Go Wrong
Data without interpretation isn’t a report, it’s a spreadsheet with a logo on it. If organic traffic dropped, say why (a seasonal dip, an algorithm update, a technical issue that’s since been fixed) instead of letting the client assume the worst or, just as bad, ignoring the dip and hoping they don’t notice. If a ranking went up but traffic didn’t follow, explain that too — search volume for that term might be low, or the ranking might be for a position that doesn’t get many clicks yet. Clients trust reports more when they include the occasional piece of bad news explained honestly than when every report is uniformly positive; a report that never shows a dip reads as curated rather than credible.
How Often to Report
Monthly is the standard cadence for most ongoing SEO retainers, since SEO moves too slowly for weekly reporting to show meaningful change and too quickly for quarterly reporting to catch problems early. Some agencies supplement the monthly formal report with a lighter weekly or biweekly check-in — a short email or a live dashboard link — specifically so that if something breaks (a site outage, a ranking drop, an indexing issue) it doesn’t sit unnoticed for a month before the client hears about it. A live, always-current dashboard like SEO Rocket’s built-in one is a natural fit for that in-between visibility, since it doesn’t require anyone to build or send anything for the client to check current status.
A Simple Reporting Template to Start From
If you’re building your own report from scratch, this order works as a reliable default: (1) one-paragraph summary, (2) organic traffic and conversions vs. prior period, (3) keyword ranking movement grouped by priority, (4) top and bottom performing pages, (5) work completed this period with specifics, (6) open issues and their status, (7) next period’s plan. Keep it to what fits comfortably on one screen or two printed pages for the summary sections — clients skim, and a report that respects that gets read more often than one that doesn’t.
Frequently Asked Questions
Should I show clients raw ranking data or just summarize it?
Both, structured well — a short summary of overall movement up top, with the full keyword table available for clients who want to dig in, rather than forcing everyone to scroll through every tracked term to find the headline.
What if the numbers are bad this month?
Report them anyway, with context. Explaining a dip honestly, along with what’s being done about it, builds more long-term trust than omitting or softening bad news, which clients tend to notice eventually regardless.
Does SEO Rocket’s dashboard replace a written report entirely?
For many clients, yes — a live link they can check anytime covers the core need. Some agencies still send a periodic written summary alongside it for context and narrative, especially for larger or more strategic accounts.
How do I show ROI in an SEO report if the client doesn’t track sales internally?
Use the best available proxy — GA4 key events like form submissions or calls — and be upfront that it’s a proxy for revenue, not confirmed revenue, unless the client has closed-loop sales data to connect back to specific leads.
If manually assembling reports every month is eating into billable time, SEO Rocket’s built-in dashboard gives clients a live, shareable view of rankings, traffic, and completed work with no setup. Try it free at app.seorocket.ai.